

UPDATE: I changed electric data-point due to excellent comment by Dr. Adam. Assumptions $2.99 per gallon of gasoline (source: Dept of Energy, west coast average including CA) 17,976 miles driven per year (source: Federal Hwy Administration, 32 year old male) About Project Graph: At Wharton we’re taught that everything can be graphed. This is my …
Author Archives: Neal Mueller
Let’s Go On A Walk

About Project Graph: At Wharton we’re taught that everything can be graphed. This is my attempt to graph my goings-on.
Facebook Friend Locations
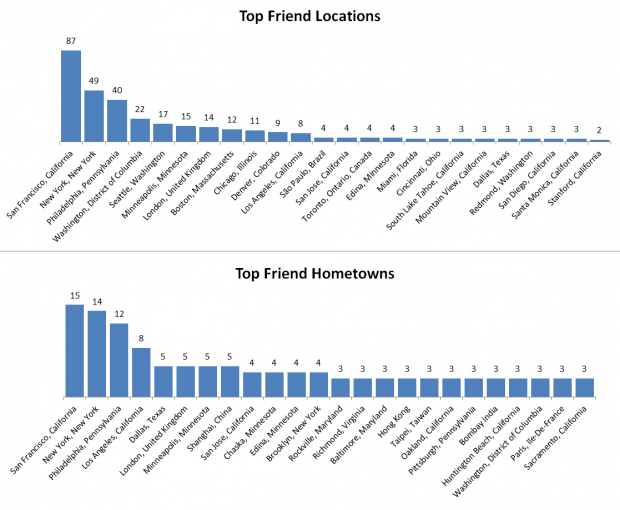
Docs.com allows you to chart your Facebook friends. Even thought I grew up in Minnesota it looks like I socialize a lot more with people from the coasts. This makes sense since I went to school out east and work in the west. Thanks to Pete at http://www.openheatmap.com for making this based on my Facebook …
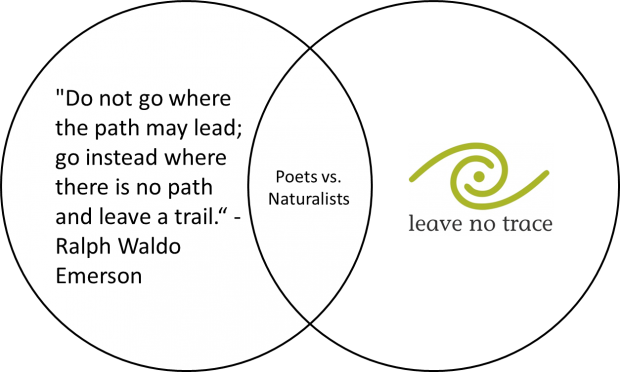
Poets vs. Naturalists
About Project Graph: At Wharton we’re taught that everything can be graphed. This is my attempt to graph my goings-on.
School Of Hard Knocks

About Project Graph: At Wharton we’re taught that everything can be graphed. This is my attempt to graph my goings-on.
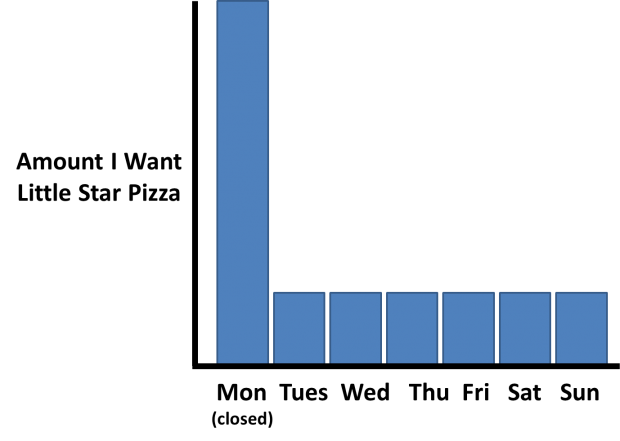
You Want What You Can’t Have
About Project Graph: At Wharton we’re taught that everything can be graphed. This is my attempt to graph my goings-on.
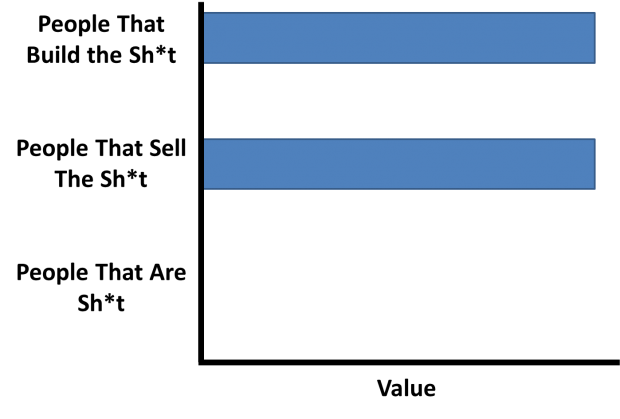
Three Types Of Workers
About Project Graph: At Wharton we’re taught that everything can be graphed. This is my attempt to graph my goings-on.
Crowdsourcing Revolutionizes Labor Costs

I’m always interested in news ways of getting work done. Crowdsourcing is definitely new. It employs the power of the internet to find thousands (even millions) of workers to complete large but simple projects. Example are: sales force example: add twitter links and company names to a list of contact leads website example: removing explicit …
Eco-friendly Ways To Get Around Town

This graph created at Dolores Park while watching Tenzing play. About Project Graph: At Wharton we’re taught that everything can be graphed. This is my attempt to graph my goings-on.
Likelihood of Unavoidable Delay

This graph inspired by a delightful meal with Megann Young in San Francisco. About Project Graph: At Wharton we’re taught that everything can be graphed. This is my attempt to graph my goings-on.